「React(リアクト)」はMeta(旧Facebook)が開発したJavaScriptフレームワークです。世界中のIT技術者1万人以上から取ったアンケートの結果をまとめた「State of JavaScript」において、2016年から2022年まで常にトップの利用率を維持しているフロントエンドフレームワークです。
JavaScript開発ライブラリ「Wijmo(ウィジモ)」はReactをサポートしており、Reactの標準的な方法でグリッド/入力/チャートなどのエンタープライズ開発で必要とされるWijmoのコンポーネントを利用することができます。
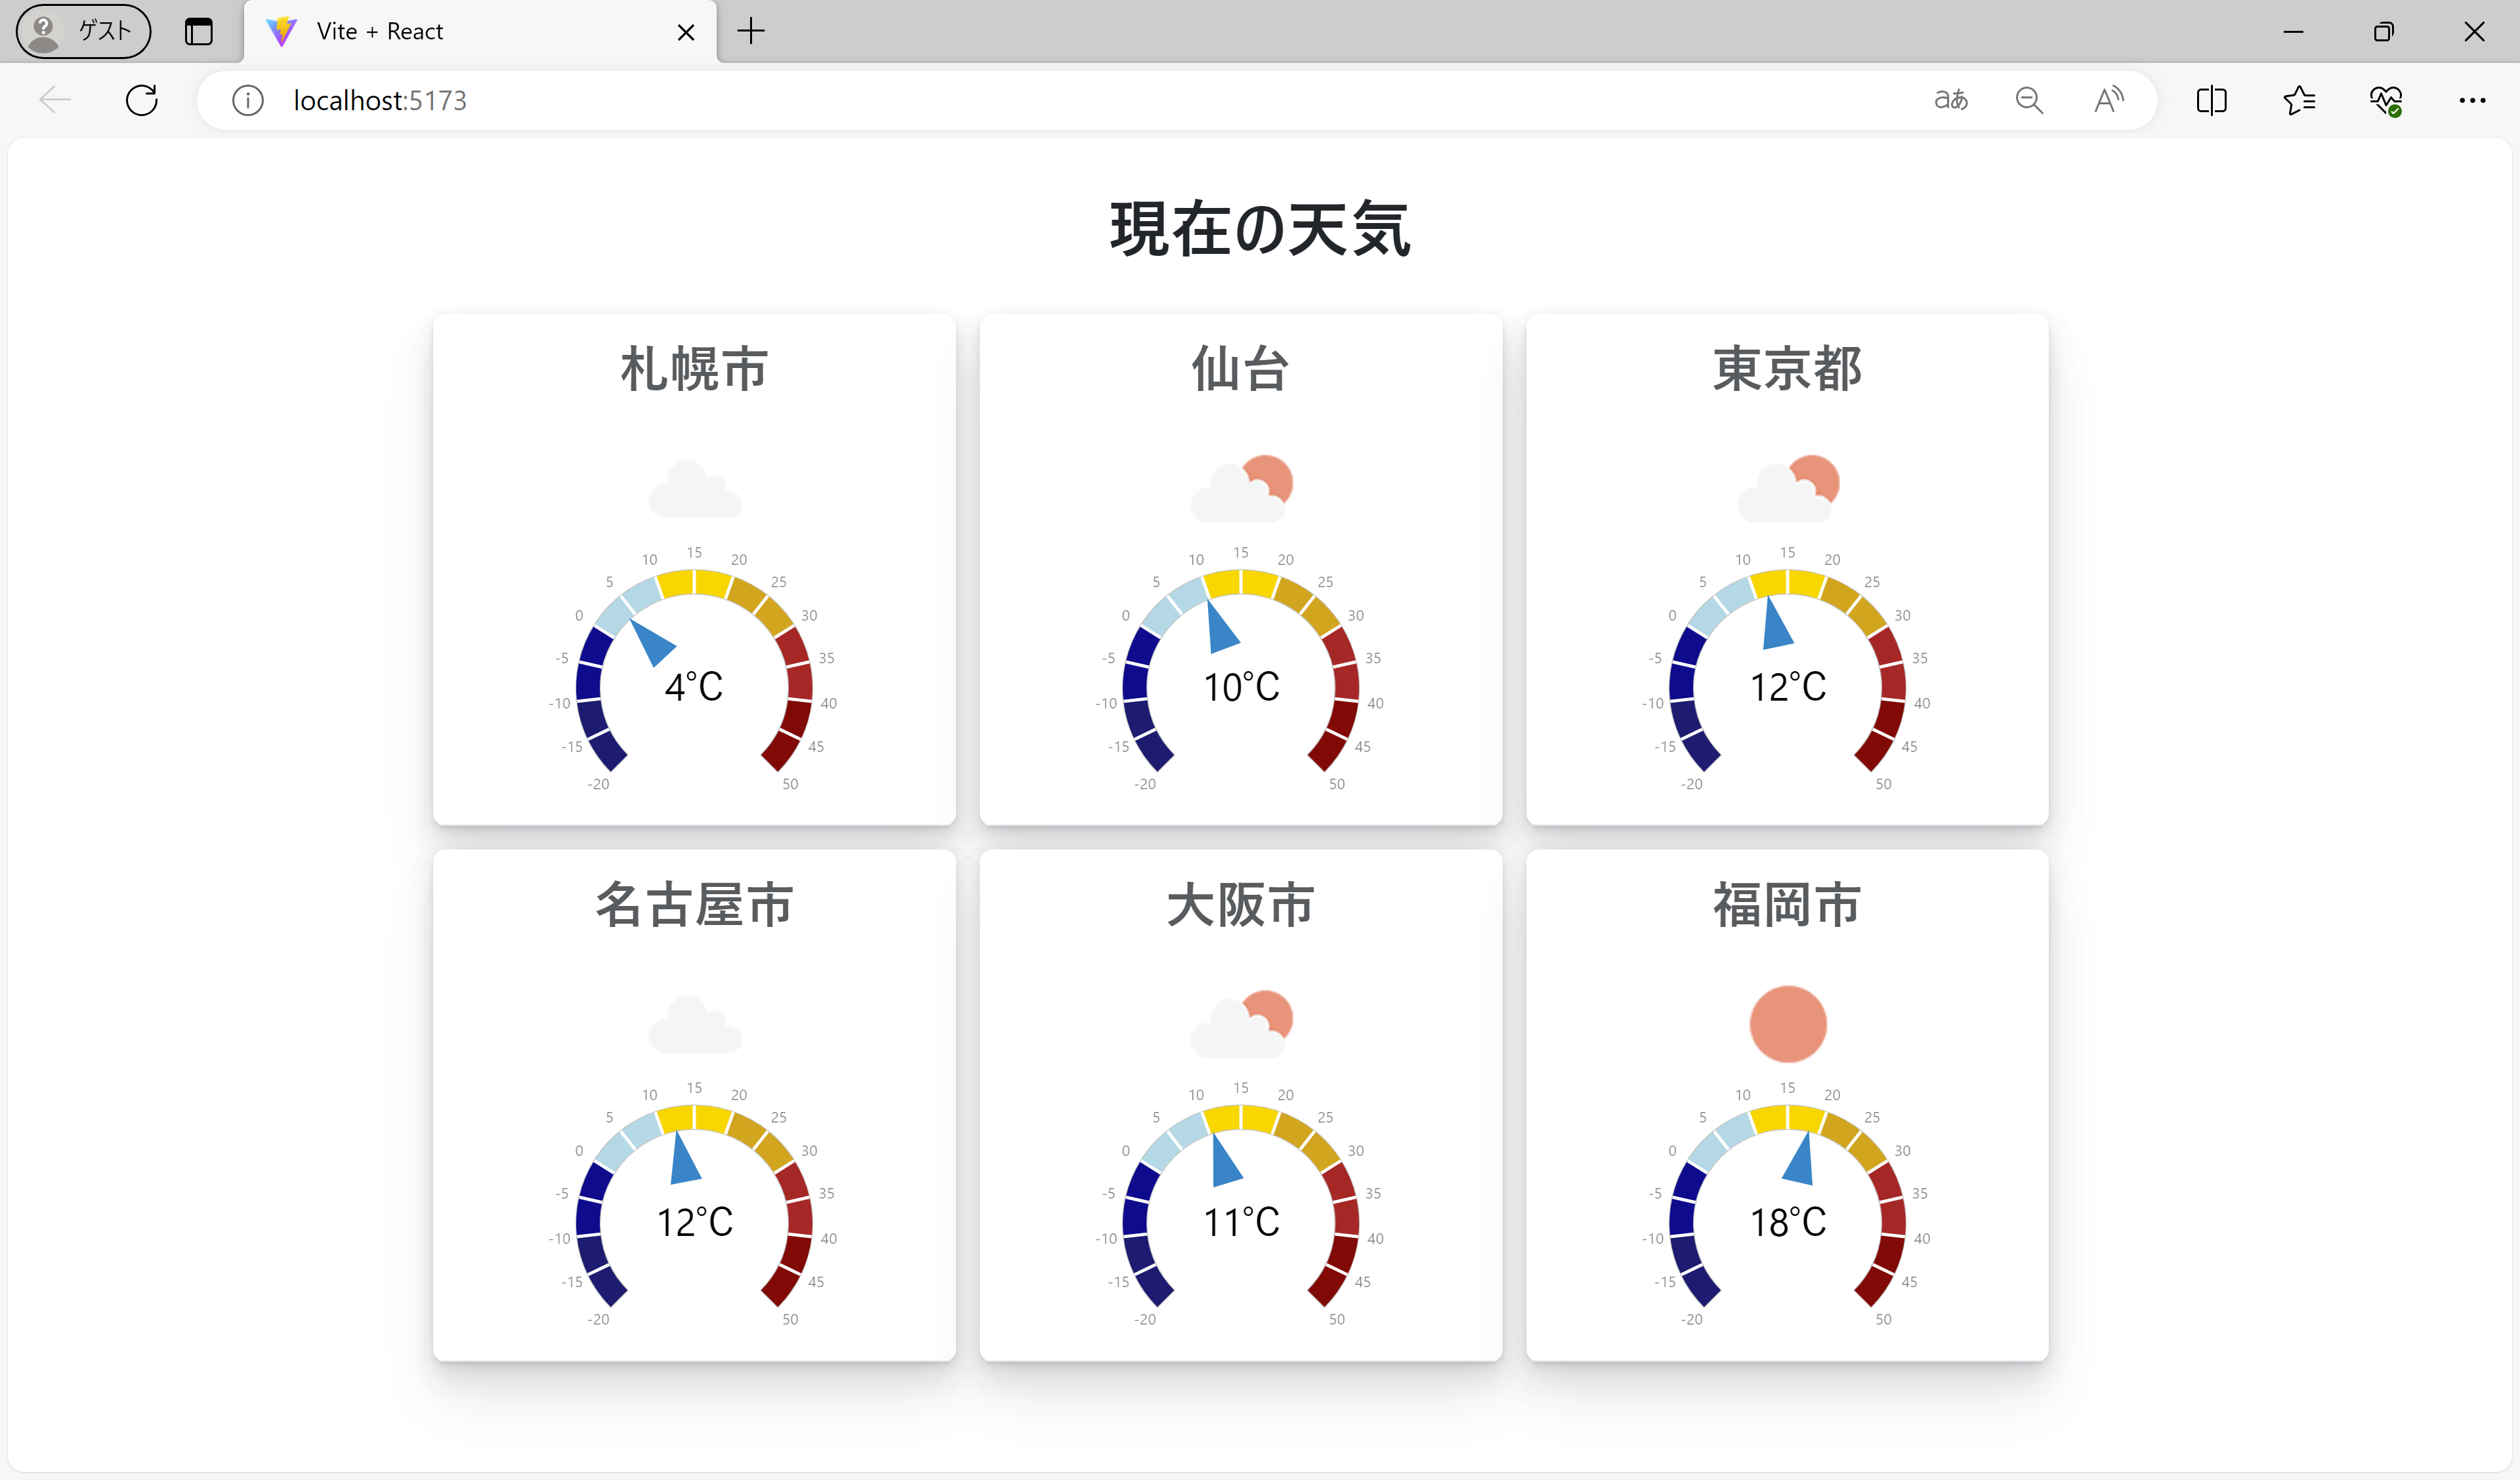
本記事では、数あるWijmoのコントロール群の中から、データの可視化に役立つ「ゲージ」コントロールをReactアプリケーションに組み込み、APIから取得した気象データを可視化する方法をご紹介します。
ViteでReactアプリケーションの作成
Reactのアプリを作成する方法はいくつかありますが、今回はビルドツール「Vite」を使用します。
以下のコマンドを実行して、ベースとなるReactアプリケーションを作成します。今回は「react」のオプションを指定してReactとJavaScriptのアプリケーションをスキャフォールドします。
※ 使用可能なテンプレートはこちらをご覧ください。
npm create vite wijmo-gauge-app -- --template react次に以下のコマンドを実行してアプリケーションプロジェクトのフォルダに移動し、必要なパッケージのインストールを行います。
cd wijmo-gauge-app
npm install
パッケージがインストールされたら、以下のコマンドを実行してReactアプリケーションを起動します。
npm run devブラウザで「http://localhost:5173/」を参照すると以下のように開発サーバーでReactアプリケーションの実行を確認できます。
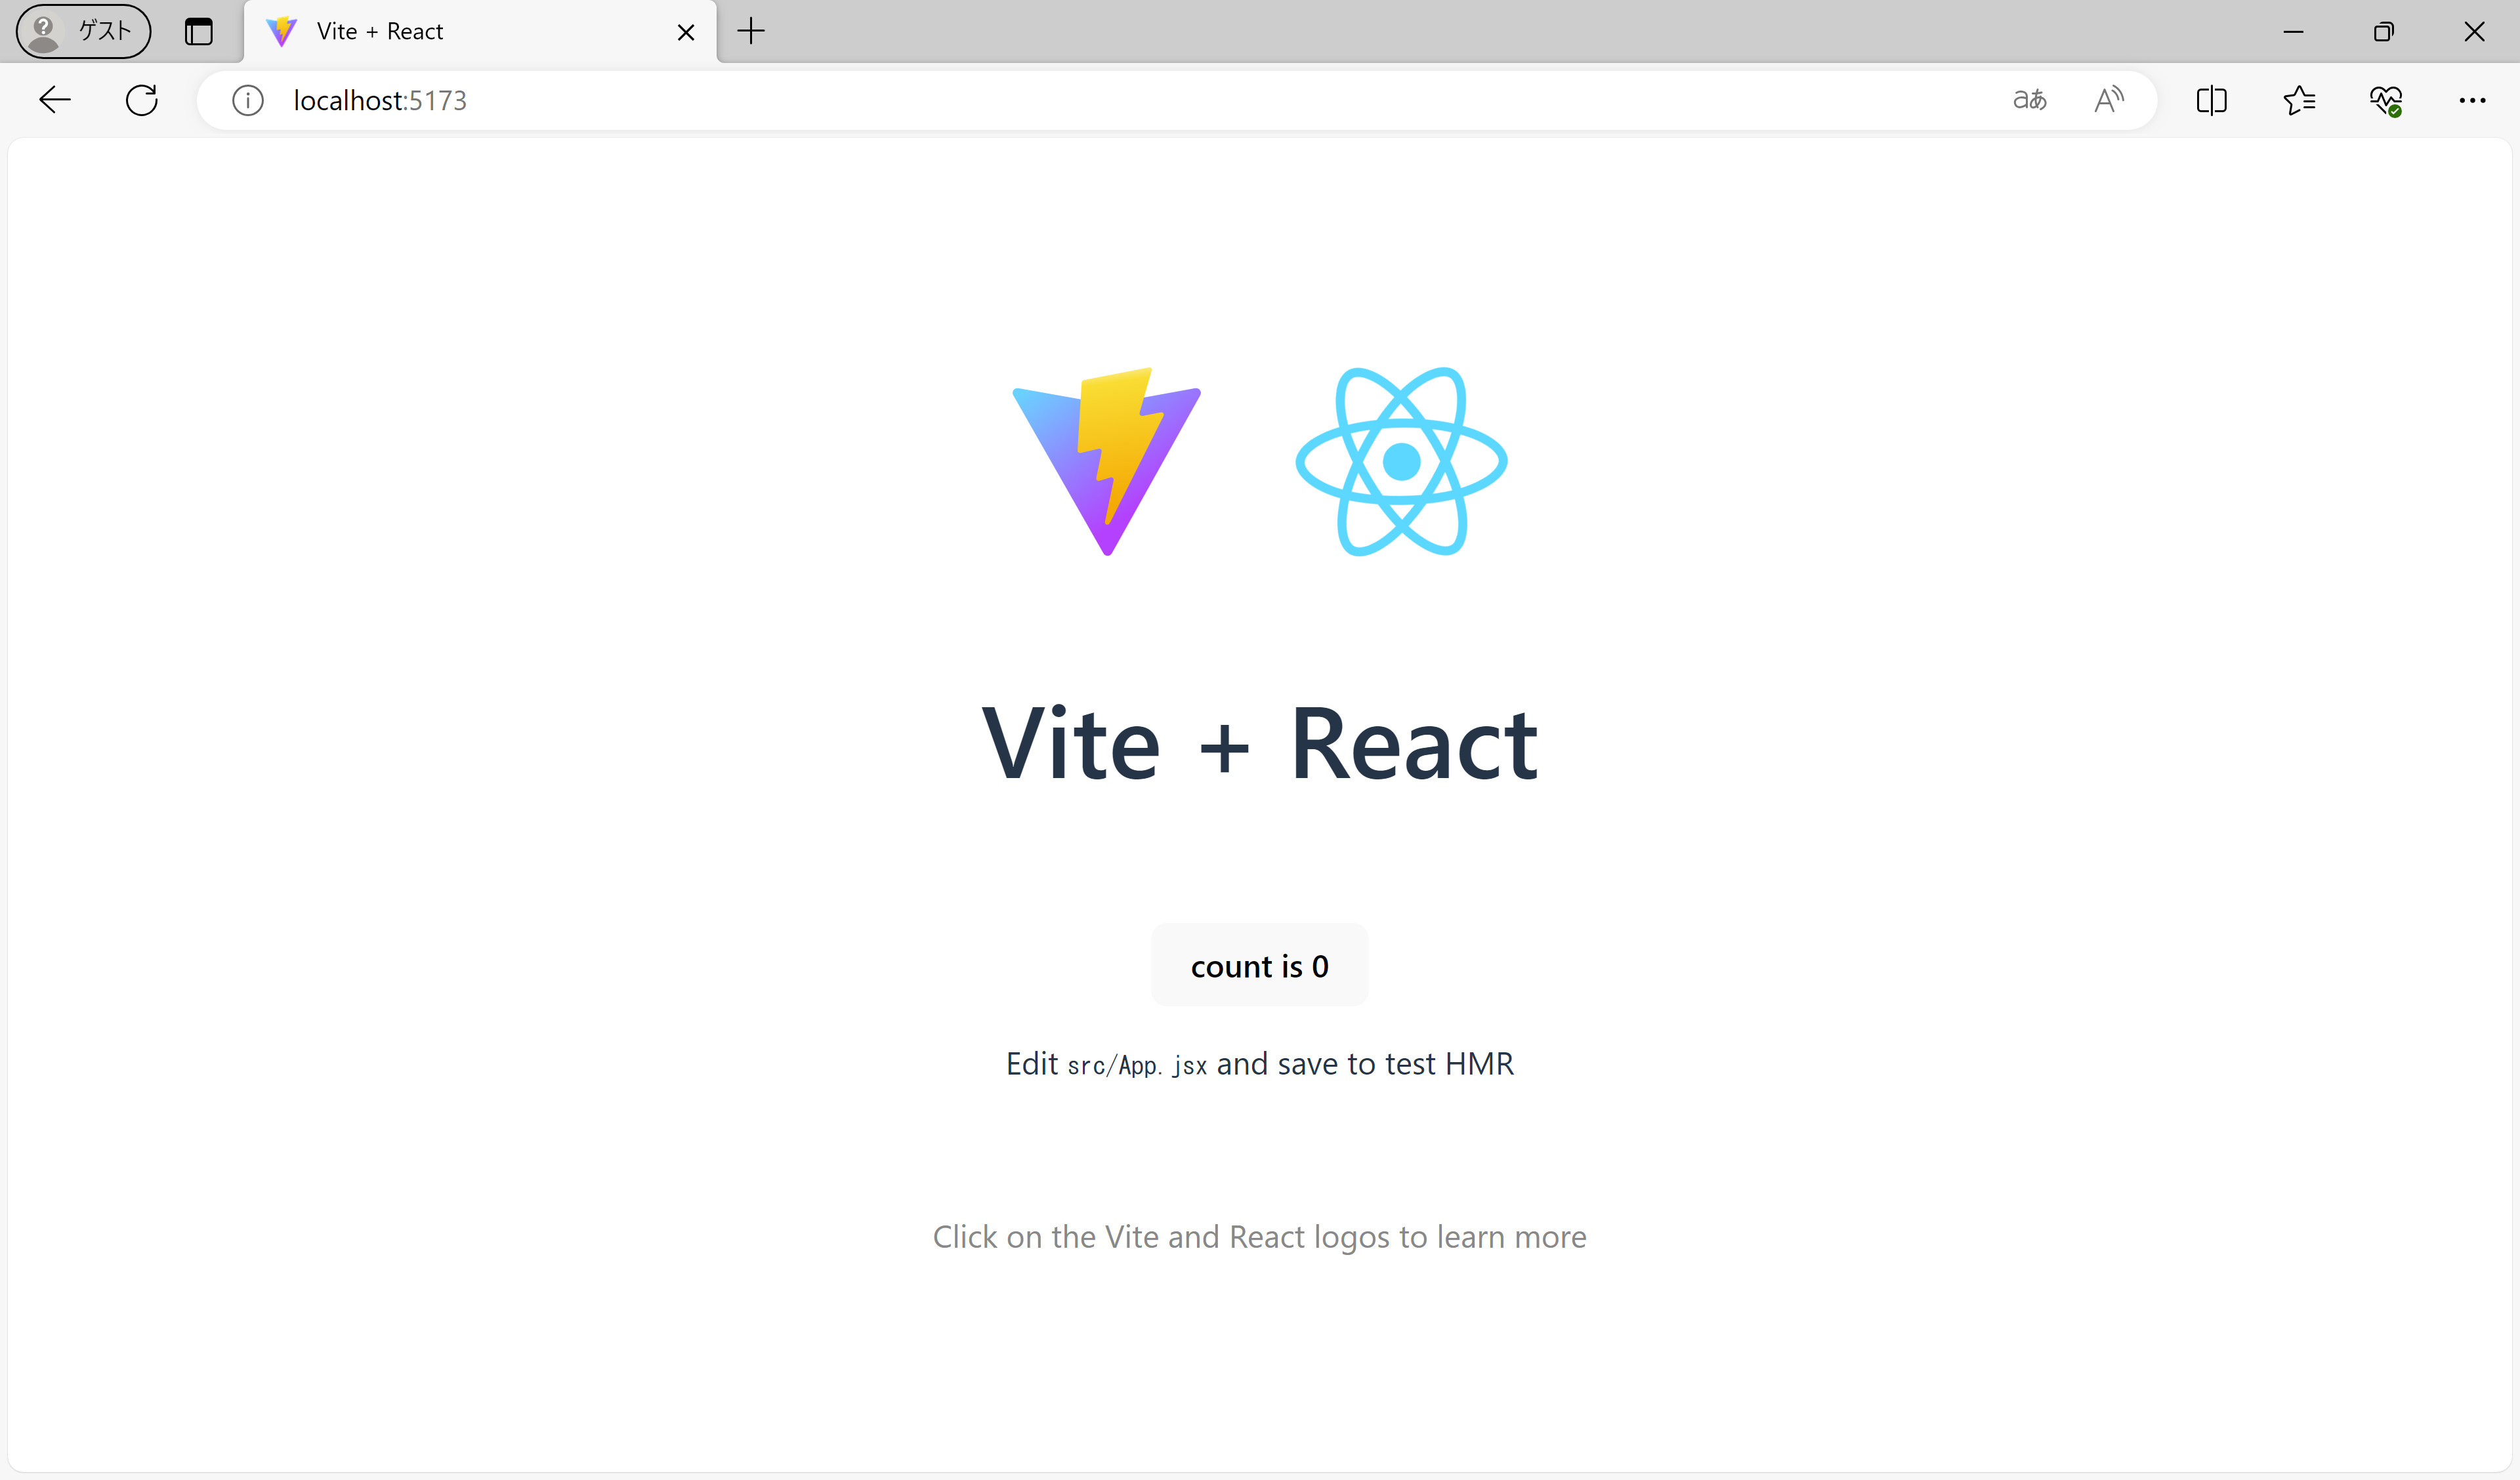
アプリケーションの起動を確認したらCtrl+Cキーを押して終了しておきます。
Wijmoのインストール
ベースとなるReactのアプリケーションが作成されたら、「npm install」コマンドを実行して、Wijmoのインストールを行います。WijmoではReact専用のパッケージが提供されているので、そちらをアプリケーションにインストールします。また、スタイルの調整のためCSSフレームワークの「Bootstrap」もインストールします。
npm install @grapecity/wijmo.react.all
npm install bootstrap
OpenWeatherMapのAPIキーの取得
ゲージに表示するデータには「OpenWeatherMap」が提供している気象データを使用します。
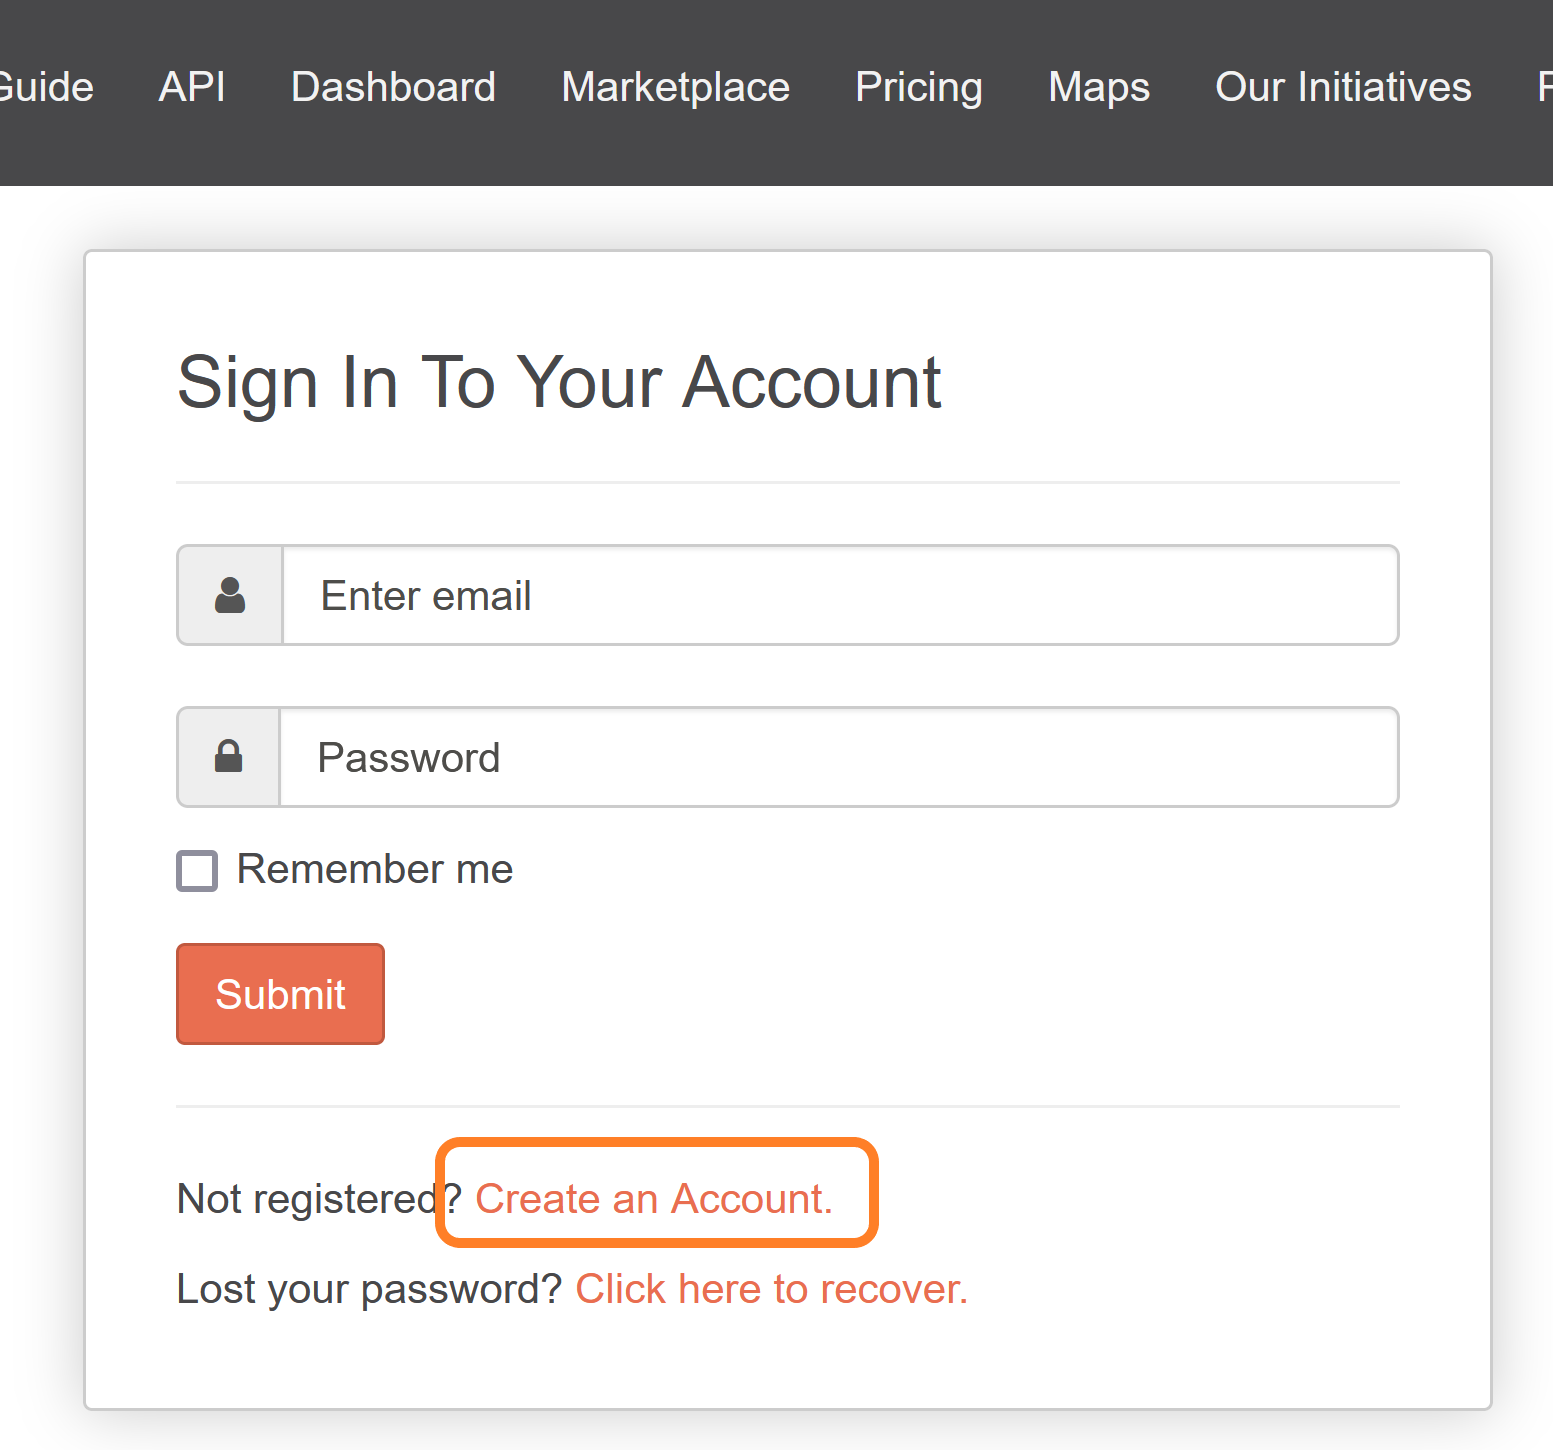
上記のリンクからOpenWeatherMapのWebサイトにアクセスし、右上の「Sign in」のメニューを押下します。

すでにアカウントがある場合はログインし、アカウントがない場合は「Create an Account」のメニューからアカウントを作成します。
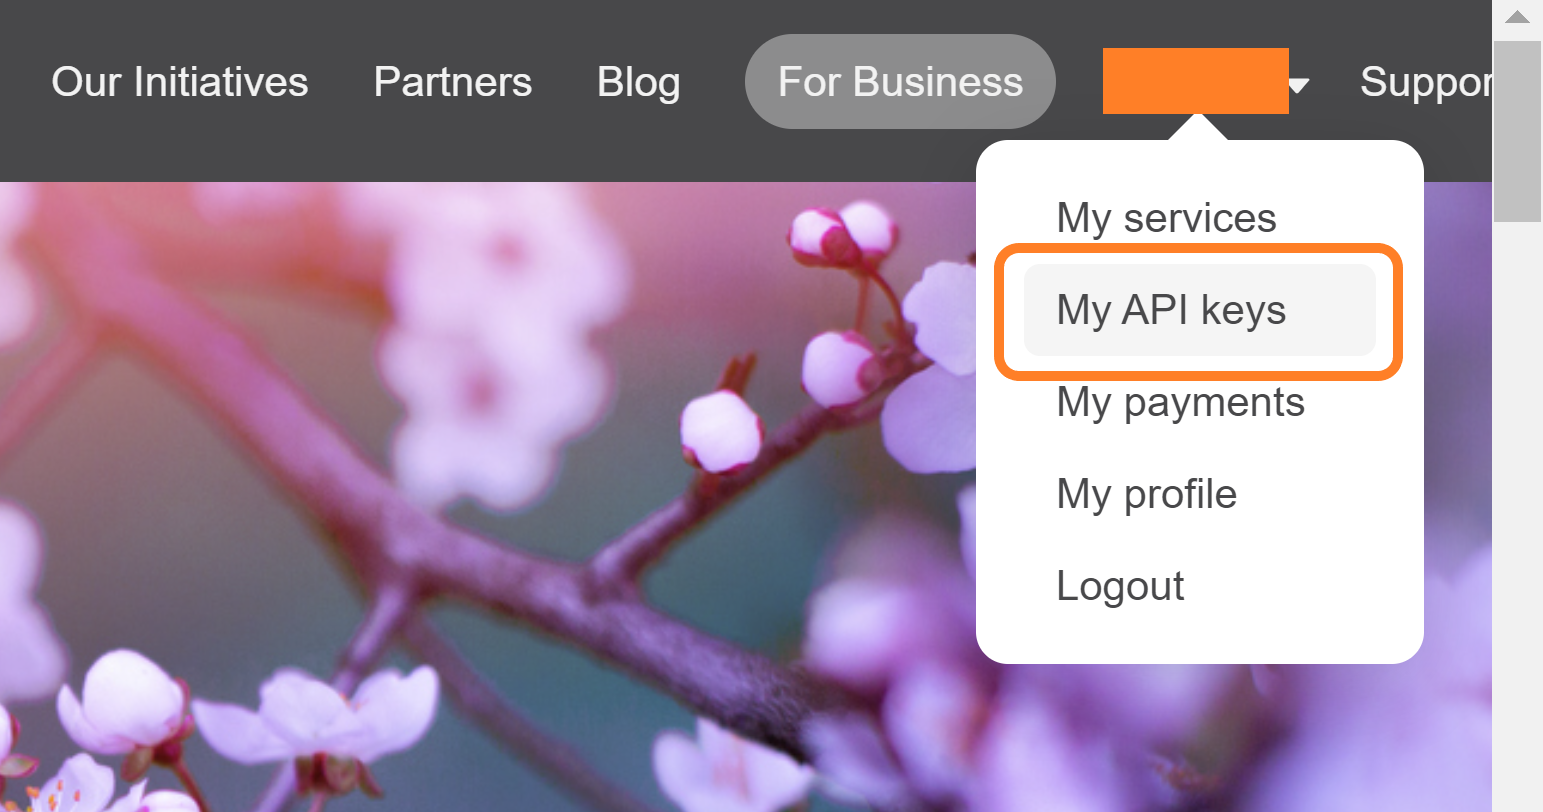
ログインができたら右上の「My API keys」のメニューからAPIキーを取得します。
アプリケーションにWijmoの組み込み
以上で事前の準備が全て完了したので、次にアプリケーションにゲージの組み込みを行っていきます。「src\WeatherComponent.jsx」を新たに作成し、以下のように記述します。
※ ライセンスキーを設定しない場合トライアル版を示すメッセージが表示されます。ライセンスキーの入手や設定方法についてはこちらをご覧ください。
import React, { useState, useEffect, useCallback } from 'react';
import * as wjCore from "@grapecity/wijmo";
import * as wjGauge from '@grapecity/wijmo.react.gauge';
import { ShowText, RadialGauge as rg } from '@grapecity/wijmo.gauge';
import '@grapecity/wijmo.styles/wijmo.css';
import '@grapecity/wijmo.cultures/wijmo.culture.ja';
import './App.css';
import 'bootstrap/dist/css/bootstrap.css';

wjCore.setLicenseKey('ここにWijmoのライセンスキーを設定します');

const WeatherComponent = (props) => {
    const [weatherData, setWeatherData] = useState(null);
    const apiKey = 'ここに作成したOpenWeatherMapのAPIキーを設定します';
    const city = props.city;

    const getTextCallback = useCallback((gauge, part, value, text) => {
        return `${text}℃`;
    });

    useEffect(() => {
        const fetchWeatherData = async () => {
            try {
                const response = await fetch(
                    `https://api.openweathermap.org/data/2.5/weather?lang=ja&q=${city}&units=metric&appid=${apiKey}`
                );
                const data = await response.json();

                setWeatherData(data);
            } catch (error) {
                console.error('Error fetching weather data:', error);
            }
        };

        fetchWeatherData();
    }, [city, apiKey]);

    return (
        <div>
            {weatherData && (
                <>
                    <div className="tile">
                        <div className="tile-container">
                            <div className="tile-header">
                                <h2>{weatherData.name}</h2>
                                <img
                                    className="iconImg"
                                    src={`https://openweathermap.org/img/wn/${weatherData.weather[0].icon}@2x.png`}
                                />
                            </div>

                            <div className="tile-content">
                                <wjGauge.RadialGauge
                                    autoScale={false}
                                    thickness={0.2}
                                    showText={ShowText.Value}
                                    getText={getTextCallback}
                                    min={-20}
                                    max={50}
                                    value={weatherData.main.temp}
                                    startAngle={-45}
                                    sweepAngle={270}
                                    showTicks={true}
                                    showTickText={true}
                                    tickSpacing={5}
                                    isReadOnly={true}
                                    showRanges={true}
                                    needleLength={'Inner'}
                                    needleElement={rg.createNeedleElement([
                                        { x: 40, y: 15 },
                                        { x: 90, y: 0 },
                                    ])}
                                >
                                    <wjGauge.Range wjProperty="pointer" thickness={0} />
                                    <wjGauge.Range min={-20} max={-10} color="MidnightBlue" />
                                    <wjGauge.Range min={-10} max={0} color="DarkBlue" />
                                    <wjGauge.Range min={0} max={10} color="LightBlue" />
                                    <wjGauge.Range min={10} max={20} color="Gold" />
                                    <wjGauge.Range min={20} max={30} color="GoldenRod" />
                                    <wjGauge.Range min={30} max={40} color="FireBrick" />
                                    <wjGauge.Range min={40} max={50} color="DarkRed" />
                                </wjGauge.RadialGauge>
                            </div>
                        </div>
                    </div>
                </>
            )}
        </div>
    );
};
export default WeatherComponent;上記のコードでは、先ほど取得したOpenWeatherMapのAPIキーを使用し、無料で使える現在の気象データを返却するAPIをコールし、コンポーネントの引数(props)で受け取った都市名の気象データを取得します。
・・・(中略)・・・
const WeatherComponent = (props) => {
    const [weatherData, setWeatherData] = useState(null);
    const apiKey = 'ここに作成したOpenWeatherMapのAPIキーを設定します';
    const city = props.city;

・・・(中略)・・・

    useEffect(() => {
        const fetchWeatherData = async () => {
            try {
                const response = await fetch(
                    `https://api.openweathermap.org/data/2.5/weather?lang=ja&q=${city}&units=metric&appid=${apiKey}`
                );
                const data = await response.json();

                setWeatherData(data);
            } catch (error) {
                console.error('Error fetching weather data:', error);
            }
        };

        fetchWeatherData();
    }, [city, apiKey]);
・・・(中略)・・・取得したデータはWijmoのゲージコントロールとバインドし、「円形ゲージ」として表示します。コールバック関数を使用して、表示する気温の数値に「℃」の文字列を連結して表示している点がポイントです。
・・・(中略)・・・
const getTextCallback = useCallback((gauge, part, value, text) => {
    return `${text}℃`;
});
・・・(中略)・・・
<div className="tile-content">
    <wjGauge.RadialGauge
        autoScale={false}
        thickness={0.2}
        showText={ShowText.Value}
        getText={getTextCallback}
・・・(中略)・・・円形ゲージに設定している各種プロパティについてはAPIリファレンスをご覧ください。
次に「src\App.jsx」を以下のように書き換えます。先ほど作成したWeatherComponentを表示する都市の分mapメソッドで繰り返し読み込み、引数として都市名を渡します。
import React from 'react';
import WeatherComponent from './WeatherComponent';

const city = ['Sapporo', 'Tokyo', 'Fukuoka'];

const cityList = city.map((item, index) => {
  return <WeatherComponent key={index} city={item} />
})

function App() {

  return (
    <div className="App">
      <header className="App-header">
        <h1>現在の天気</h1>
      </header>

      <main className="city-list">
        {cityList}
      </main>
    </div>
  );
}

export default App;
次に「src\App.css」を以下のように設定し、各要素のスタイルを調整します。
h2 {
  text-align: center;
}

.App-header {
  text-align: center;
  margin-top: 2rem;
  margin-bottom: 2rem;
}

.iconImg {
  height: 100px;
  width: 100px;
}

.tile {
	background: white;
	border-radius: 0.5rem;
	box-sizing: border-box;
	margin-right: 15px;
	margin-bottom: 15px;
	box-shadow: 0 1px 2px rgba(55, 63, 66, 0.07), 0 2px 4px rgba(55, 63, 66, 0.07), 0 4px 8px rgba(55, 63, 66, 0.07),
		0 8px 16px rgba(55, 63, 66, 0.07), 0 16px 24px rgba(55, 63, 66, 0.07), 0 24px 32px rgba(55, 63, 66, 0.07);
}

.tile .tile-container {
	border-bottom: 1px solid #e0e0e0;
	padding: 0.75rem 1rem;
}

.tile .tile-header {
	padding: 0.125rem;
	opacity: 0.75;
	text-align: center;
	font-size: 20px;
}

.tile .tile-content {
	display: flex;
	align-items: center;
	justify-content: center;
	flex-direction: column;
	height: 90%;
}

.city-list{
	display: flex;
	flex-wrap: wrap;
	width: 1050px;
	margin: auto;
}
最後に仕上げとして「src\index.css」に設定されているデフォルトのスタイルを全て削除します。
(デフォルトのスタイルを削除)以上の手順で、実装は完了です。再び「npm run dev」コマンドを実行して「http://localhost:5173/」に接続すると、Wijmoのゲージ上にAPIから取得した各都市の気象データ(現在の天気と気温)が表示されます。
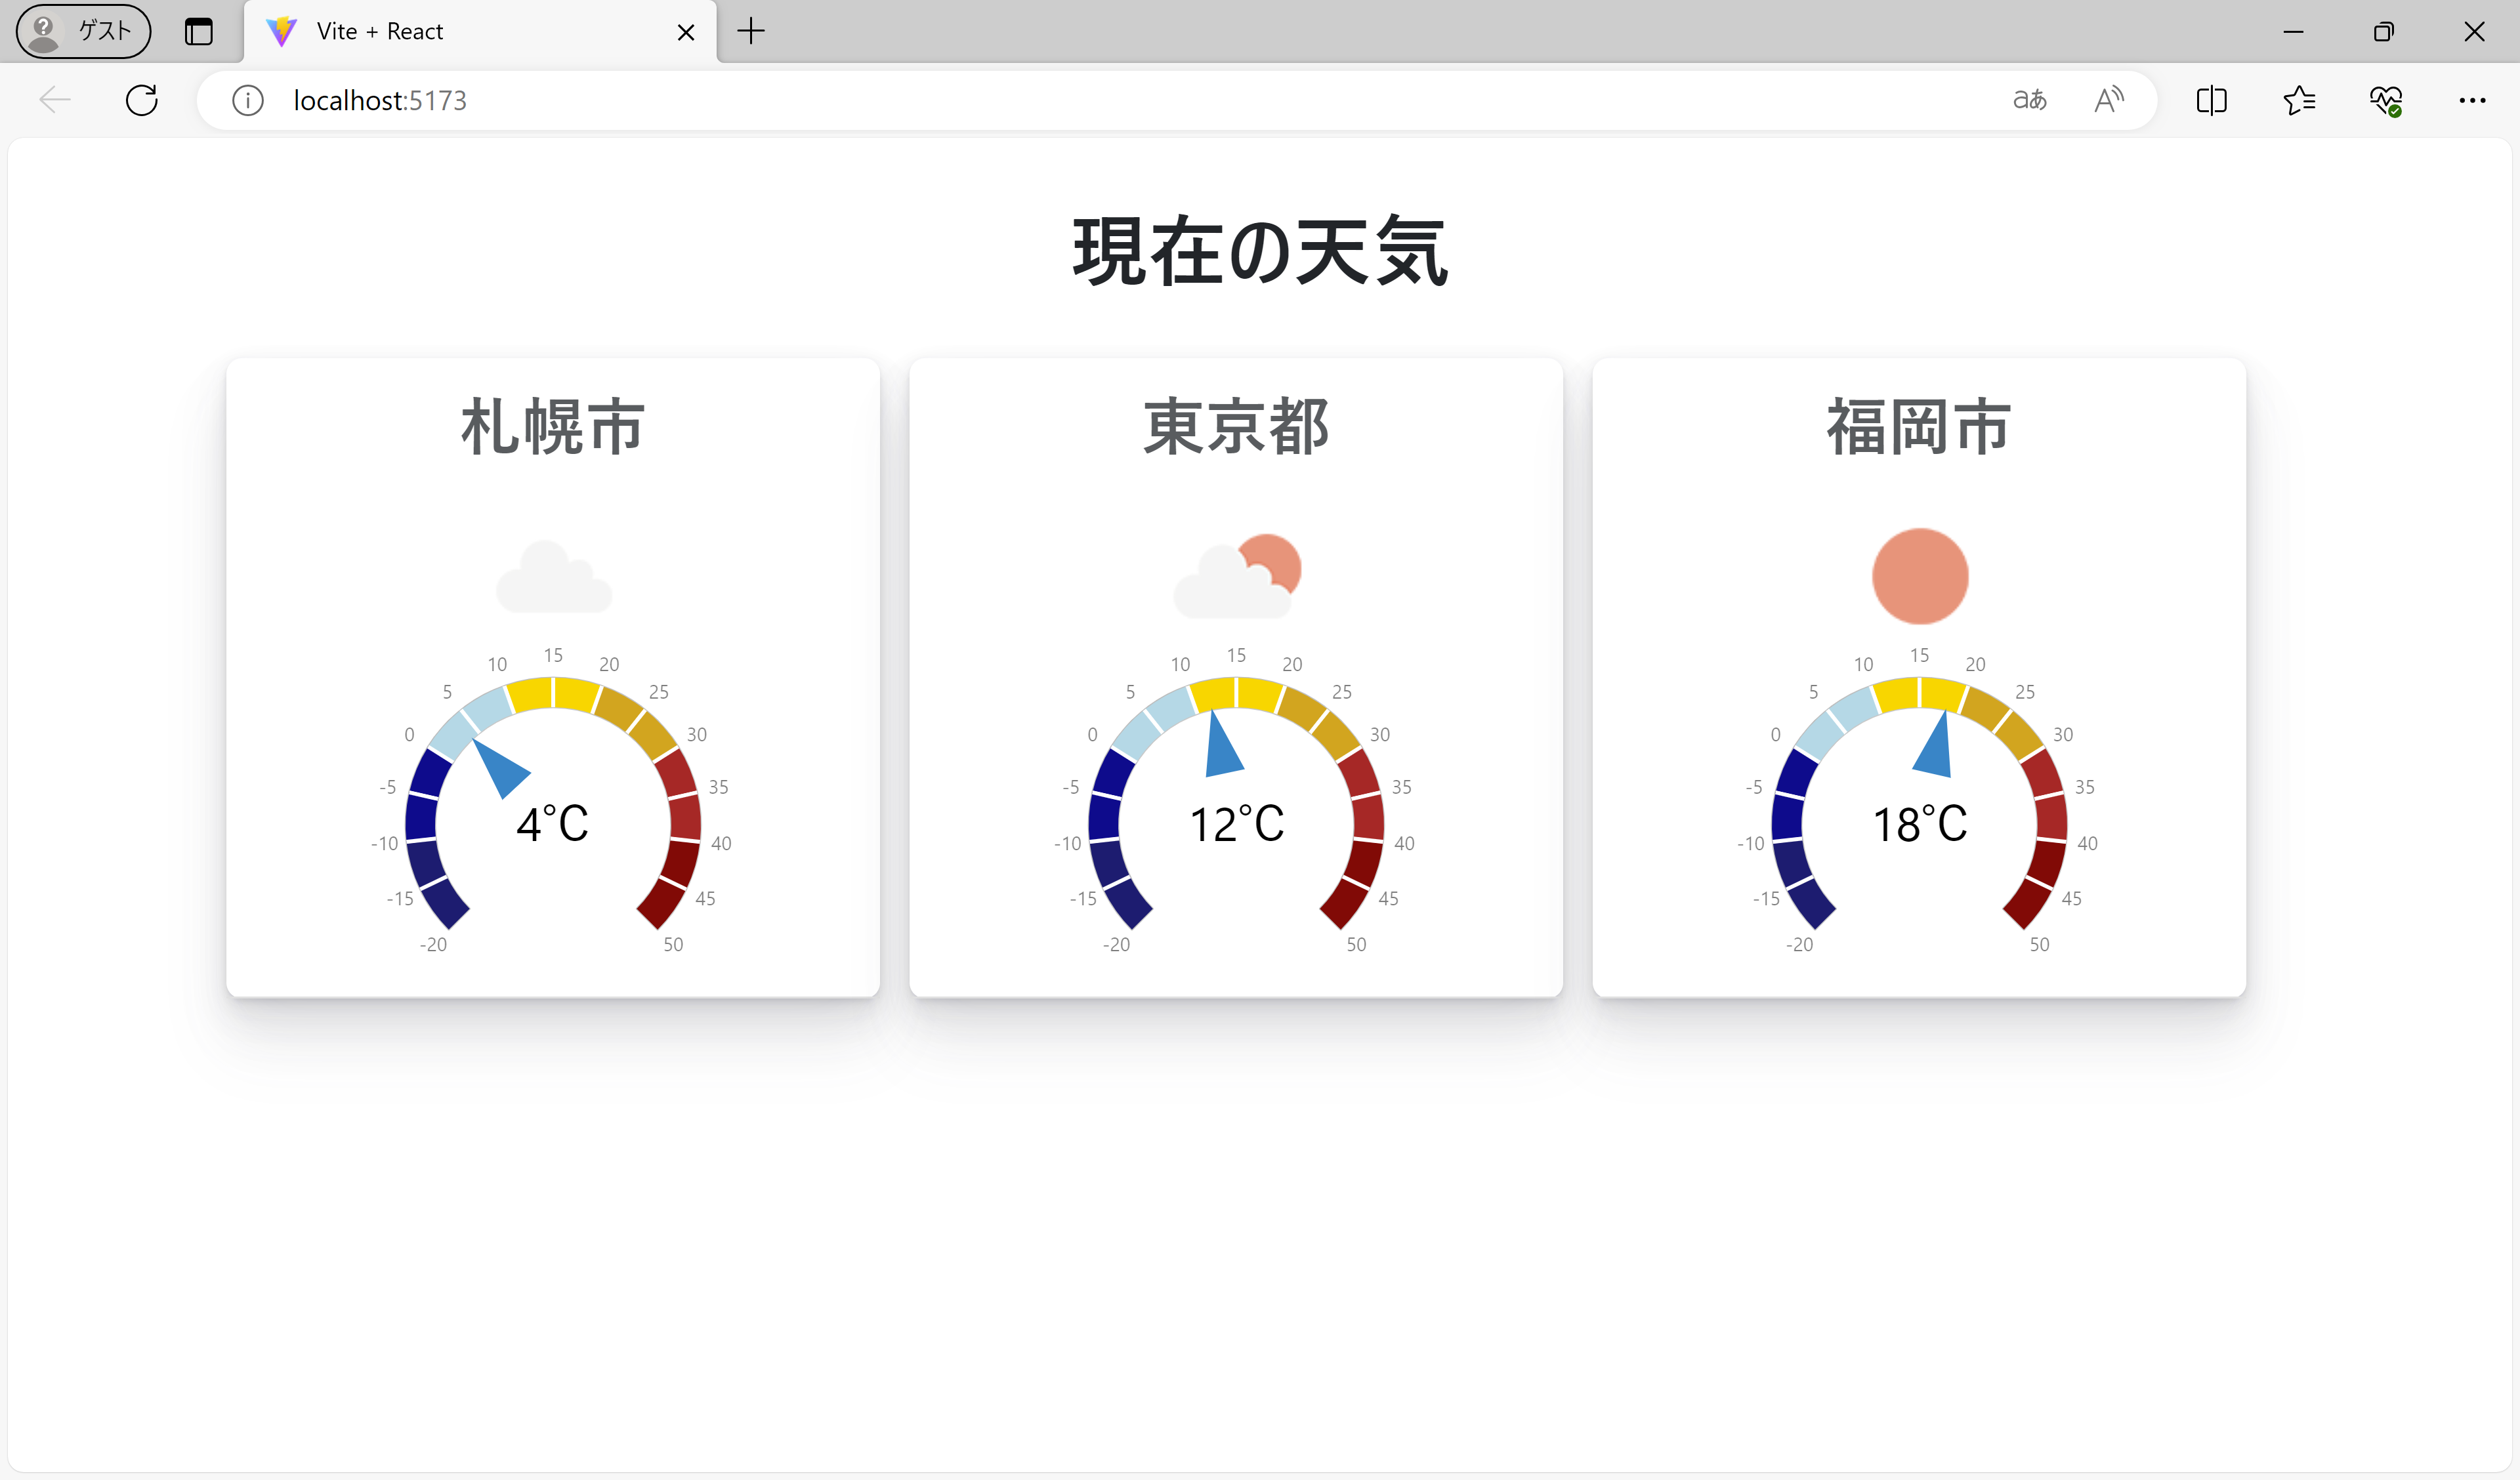
「src\App.jsx」において、配列に設定する都市名を増やすと表示するデータも連動して増えます。
import React from 'react';
import WeatherComponent from './WeatherComponent';

const city = ['Sapporo', 'Sendai', 'Tokyo', 'Nagoya', 'Osaka', 'Fukuoka'];
・・・(中略)・・・
さいごに
以上がWijmoの「ゲージ」コントロールをReactアプリケーションに組み込み、OpenWeatherMapのAPIから取得した気象データを可視化する方法でした。
製品サイトでは、Wijmoの機能を手軽に体験できるデモアプリケーションやトライアル版も公開しておりますので、こちらもご確認ください。
また、ご導入前の製品に関するご相談、ご導入後の各種サービスに関するご質問など、お気軽にお問合せください。
